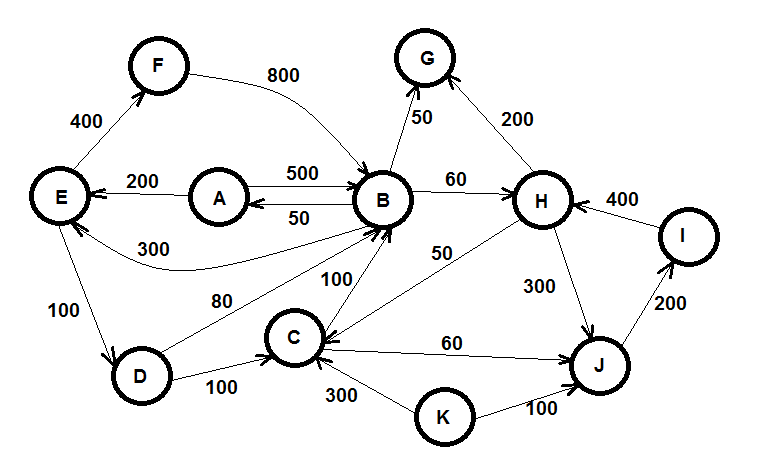
Test graph with results illustrated
| Cycle number | Cycle's nodes | Amount reduced |
|---|---|---|
| 1 | A, B | 50 |
| 2 | B, E, D | 80 |
| 3 | B, E, D, C | 20 |
| 4 | B, E, F | 200 |
| 5 | B, H, C | 50 |
| 6 | H, J, I | 200 |
| ∑ | Total Reduced Obligations | 600 |
| Node | AR reduced | From | In Cycles | AP reduced | To | In Cycles |
|---|---|---|---|---|---|---|
| A | 50 | B | 1 | 50 | B | 1 |
| B | 50 | A | 1 | 50 | A | 1 |
| B | 70 | C | 3, 5 | 300 | E | 2, 3, 4 |
| B | 80 | D | 2 | 50 | H | 5 |
| B | 200 | F | 4 | |||
| C | 20 | D | 3 | 70 | B | 3, 5 |
| C | 50 | H | 5 | |||
| D | 100 | E | 2, 3 | 80 | B | 2 |
| D | 20 | C | 3 | E | 300 | B | 2, 3, 4 | 100 | D | 2, 3 |
| E | 200 | F | 4 | F | 200 | E | 4 | 200 | B | 4 | H | 50 | B | 5 | 50 | C | 5 |
| H | 200 | I | 6 | 200 | J | 6 | I | 200 | J | 6 | 200 | H | 6 |
| J | 200 | H | 6 | 200 | I | 6 |
| ∑ | 1770 | total | in Balance Sheets | 1770 | total | in Balance Sheets |
Highlighted rows in previous table denote ARMO result for the participant B. Corresponding ARMO-results records are displayed in the table below.
| PPID_self | PPID_partner | DT_amount | CR_amount | Explanation |
|---|---|---|---|---|
| B | A | 50 | ARMO:1 | |
| B | E | 300 | ARMO:2+3+4 | |
| B | H | 50 | ARMO:5 | |
| B | A | 50 | ARMO:1 | |
| B | C | 70 | ARMO:3+5 | |
| B | D | 80 | ARMO:2 | |
| B | F | 200 | ARMO:4 |